
SheetsFlow
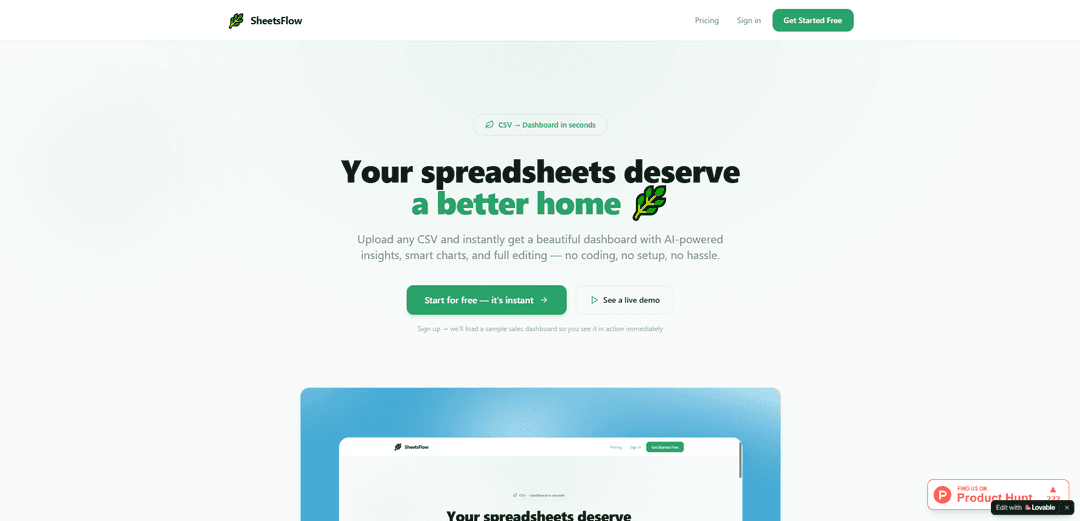
SheetsFlow is an AI-powered platform that transforms any CSV or spreadsheet into a beautiful, interactive dashboard with smart analytics and full editing capabilities in seconds - no coding required.
https://sheetsflow.lovable.app/?ref=producthunt
产品信息
更新于:2026年04月08日
什么是 SheetsFlow
SheetsFlow is a revolutionary no-code tool built on Lovable's platform that bridges the gap between raw spreadsheet data and actionable business insights. It allows users to instantly convert their CSV files and spreadsheet data into sophisticated, functional dashboards without any technical expertise. The platform combines the familiarity of spreadsheet interfaces with powerful visualization and analysis capabilities, making data management and interpretation more accessible and efficient.
SheetsFlow 的主要功能
SheetsFlow is a tool that transforms CSV files into interactive dashboards with AI-powered analytics capabilities. It offers instant visualization, automated insights generation, and full data editing functionality without requiring any coding. The platform provides cloud storage, enterprise-grade security, and allows users to work with their spreadsheet data through an intuitive interface that automatically detects data types and relationships.
AI-Powered Analysis: Automatically detects column types, generates KPIs, and provides smart chart recommendations based on data patterns
Instant Dashboard Creation: Converts CSV files into functional dashboards within 30 seconds through simple drag-and-drop functionality
Advanced Data Management: Provides spreadsheet-like editing capabilities including adding, editing, deleting, searching, sorting, and filtering records
Cloud-Based Storage: Offers secure cloud storage with enterprise-grade security and accessibility from any device
SheetsFlow 的使用场景
Sales Analytics: Transform sales data into visual dashboards for tracking performance metrics and identifying trends
Business Reporting: Convert regular business reports from spreadsheets into interactive dashboards for better data visualization and analysis
Data Collaboration: Enable teams to work together on shared datasets with real-time access and editing capabilities
优点
No coding required for dashboard creation
Quick setup with instant visualization
Secure cloud-based storage with enterprise-grade security
缺点
Limited to CSV file format input
May have constraints on customization compared to traditional BI tools
如何使用 SheetsFlow
Sign up for SheetsFlow: Visit sheetsflow.lovable.app and sign up for a free account. A sample sales dashboard will be loaded automatically to demonstrate the functionality.
Upload your CSV file: Export your data from Google Sheets, Excel or any other tool as a CSV file. Simply drag and drop the CSV file into SheetsFlow's interface.
AI Analysis: The AI will automatically detect column types, analyze relationships in your data, and generate appropriate KPIs and chart recommendations.
Review Generated Dashboard: Your data will be transformed into a complete dashboard with tables, charts, search functionality and editing capabilities within 30 seconds.
Customize and Edit: Use the built-in tools to add, edit, delete, search, sort and filter your records as needed. You can work with it similar to a spreadsheet interface.
View Visualizations: Explore the automatically generated charts including bar charts, line graphs, and pie charts that are contextually relevant to your data.
Access Anywhere: Your dashboard is saved in the cloud and can be accessed from any device at any time. Data is kept private and secure by default.
SheetsFlow 常见问题
SheetsFlow is a tool that turns CSV files into smart dashboards instantly, with AI-powered insights, smart charts, and full editing capabilities - all without requiring any coding.


与 SheetsFlow 类似的最新 AI 工具

Tomat
Tomat.AI是一款由AI驱动的桌面应用程序,使用户能够轻松探索、分析和自动化大型CSV和Excel文件,无需编码,具有本地处理和高级数据操作功能。

Gentables
Gentables是一个AI驱动的工具,可以从各种文件格式中提取和生成表格,具有表格编辑、可视化和数据处理功能。

SheetBot AI
SheetBot AI是一个AI驱动的数据分析师工具,它在电子表格中自动化数据可视化和分析任务,使用户能够在几秒钟内生成精确的图表和见解。

Aidocmaker.com
Aidocmaker.com是一个AI驱动的文档创建平台,允许用户在几分钟内轻松生成专业文档、演示文稿、电子表格和旁白。
类似 SheetsFlow 的热门 AI 工具

Microsoft Excel: Spreadsheets
Microsoft Excel是行业领先的电子表格软件,允许用户通过强大的功能(如公式、图表和AI驱动的洞察)来组织、分析和可视化数据。

ChatGPT for Google Sheets
FreemiumAI Spreadsheet
ChatGPT for Google Sheets是OpenAI的一款插件,它将ChatGPT引入表格侧边栏,让您可以使用自然语言提示构建、分析和更新多标签电子表格,包括公式和跨标签洞察。
Zoho Tables
Zoho Tables 是一款现代化的电子表格-数据库混合工具,可帮助团队通过关系链接组织数据、构建视图和仪表板、实时协作,并通过无代码和 AI 辅助实现工作流程自动化。

Airtable
Airtable 是一个 AI 驱动的云协作平台,它结合了电子表格和数据库的功能以及无代码应用程序构建功能,以帮助团队组织、跟踪和管理其工作流程和数据。