SciDraw AI
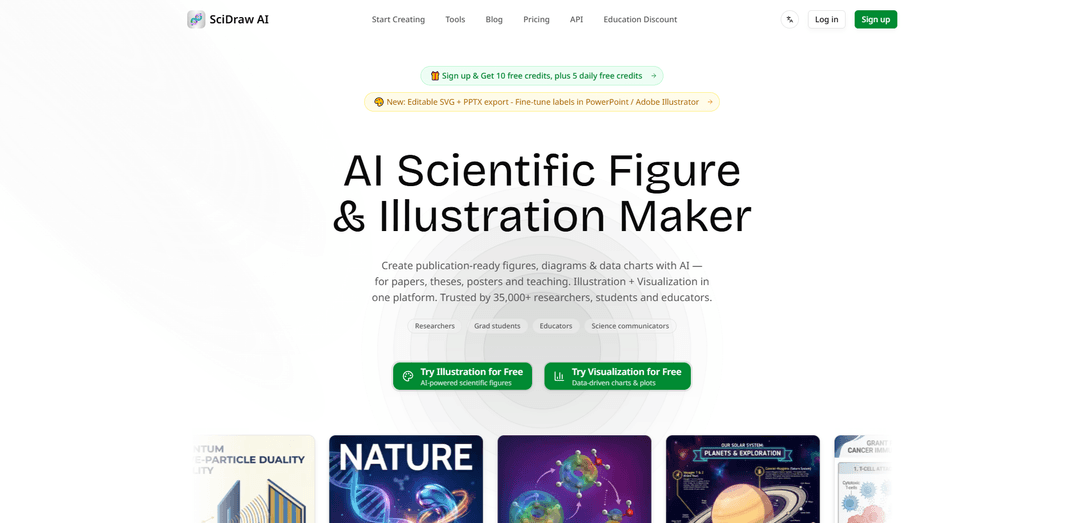
SciDraw AI is an AI-powered scientific illustration platform for researchers, graduate students, educators, and technical teams. It helps users create publication-ready scientific figures, graphical abstracts, mechanism diagrams, experimental workflows, technical schematics, and data visualizations from natural-language prompts or reference images.
https://sci-draw.com/?utm_source=aipure
Product Information
Updated:Sep 22, 2026
What is SciDraw AI
SciDraw AI is a web-based scientific figure and data-visualization tool designed for researchers, graduate students, educators, and science communicators who need clean, accurate, publication-grade graphics without spending hours in Illustrator or juggling multiple tools. It supports creating scientific diagrams (e.g., pathways, mechanisms, apparatus schematics, teaching plates), as well as data-driven plots for papers, theses, posters, and lectures. A key emphasis is producing outputs aligned with academic publishing norms—clear labeling, minimal clutter, and journal-ready styling—while still allowing downstream editing through vector and slide formats.
Key Features of SciDraw AI
SciDraw AI is a web-based, AI-powered platform for creating publication-ready scientific illustrations and data visualizations quickly, using text prompts, uploaded sketches, or reference images. It emphasizes academic standards and downstream editability by exporting editable SVG and PPTX files for refinement in tools like Illustrator, Inkscape, Figma, or PowerPoint. For data charts, it turns CSV/Excel inputs into journal-styled plots (e.g., Nature/Science/Cell presets with colorblind-safe palettes) and supports high-quality exports (PNG/PDF/EPS/TIFF) along with reproducible matplotlib/seaborn code.
Multi-modal figure generation (Prompt/Sketch/Reference): Create scientific diagrams from a text description, convert hand-drawn sketches into polished figures, or replicate/refine visuals from a reference image—useful for fast first drafts and consistent figure styles.
Editable SVG + PPTX export: Export figures as editable SVG for vector editors (Illustrator/Inkscape/Figma) and as PPTX for label/layout edits directly in PowerPoint—reducing redraw work during revisions.
Publication-style presets for major journals: Apply one-click formatting aligned with top-tier journal expectations (e.g., Nature/Science/Cell/PLOS/ACS), including colorblind-safe palettes such as Okabe–Ito for accessible, consistent styling.
AI-driven scientific data visualization from CSV/Excel: Upload data and let AI select from 10+ chart types (box, violin, scatter, heatmap, regression, etc.), generating journal-quality plots with export-ready formatting.
Reproducible plotting code export: Download the matplotlib/seaborn code that reproduces generated charts, supporting transparent, repeatable workflows and easier iteration in Python.
Multi-round conversational refinement: Iterate on figures through dialog-based edits (labels, colors, layout, details), aiming to reach publication quality within minutes rather than hours.
Use Cases of SciDraw AI
Journal figures and graphical abstracts (academia): Researchers and PhD students can draft mechanism diagrams, workflows, pathway schematics, TOC graphics, and multi-panel figures, then export editable vectors for final journal submission polishing.
Data charts for papers and supplements: Convert experimental results stored in CSV/Excel into standardized plots (e.g., violin/box/scatter with regression), export high-resolution formats and reproducible Python code for peer review and revisions.
Teaching diagrams and classroom materials: Educators can generate clear labeled diagrams (cells, organs, physics concepts, earth science cross-sections), concept maps, and cheat sheets for lectures, lab handouts, and worksheets.
Industrial R&D documentation: Teams can visualize proprietary processes, lab setups, device schematics, and experimental workflows in a clean, shareable format for design reviews, SOPs, and internal reports.
Science communication and outreach: Create simplified, accurate infographics (e.g., vaccines, CRISPR, solar system comparisons) that abstract away noise while preserving key scientific relationships for public-facing materials.
AI/engineering system diagrams: Draft architecture diagrams for model pipelines, agents, data flows, and research infrastructure, then refine in SVG/PPTX for consistent styling across reports and presentations.
Pros
Strong downstream editability via SVG and PPTX exports, which fits real publication and slide workflows.
Combines scientific illustration and data visualization in one platform, reducing tool switching.
Journal-style presets and colorblind-safe palettes support consistent, submission-ready formatting.
Chart workflow includes reproducible matplotlib/seaborn code export for transparency and iteration.
Cons
AI-generated scientific visuals can still require careful human review for factual/structural accuracy (risk of subtle errors).
Credit-based usage and subscription tiers may be limiting for heavy figure-generation workloads without budgeting.
Feature depth and template ecosystems may be less mature than long-established, domain-specific libraries in some niches (e.g., certain life-science icon sets).
How to Use SciDraw AI
1) Open SciDraw AI and choose a workflow: Go to https://sci-draw.com/ and click either “Start AI Drawing” (for illustrations/diagrams) or “Start Data Visualization” (for charts from CSV/Excel).
2) Create an illustration in AI Drawing (Prompt Mode): In AI Drawing, select the text-to-image / prompt-based mode. Write a clear one-sentence request describing the figure (topic, key components, and relationships). Example: “Draw a cell signaling pathway diagram showing receptor activation, kinase cascade, and transcription factor entering nucleus; use clean journal style with minimal labels.”
3) Create an illustration in AI Drawing (Sketch Mode): If you already have a rough draft, choose the sketch-based mode. Upload a photo/scan of your hand-drawn sketch, add a short context prompt (what the diagram represents), and let SciDraw AI convert it into a polished, publication-style figure while preserving your structure.
4) Create an illustration in AI Drawing (Reference Image / Edit Image): If you want to refine an existing figure, use the reference-image workflow (often labeled as edit/refine). Upload the reference image and specify what to change (layout, labels, styling, arrows, color palette) to generate an improved version.
5) Pick style and resolution for the figure: Set the visual style/template (e.g., journal-friendly look) and choose an output resolution (e.g., 2K/4K) depending on whether you need slides, posters, or journal submission.
6) Generate the first draft: Run generation to get an initial figure draft. SciDraw AI is designed for fast first-pass creation so you can iterate rather than perfect the first prompt.
7) Refine via multi-round conversation: Use follow-up instructions to adjust the figure: request fewer labels, clearer arrows, different grouping, reordering of steps, adding/removing components, or changing terminology. Iterate until the structure and labeling match your manuscript.
8) Export an editable vector for final polishing: Export as SVG for editing in Illustrator, Inkscape, or Figma, or export as PPTX to fine-tune labels directly in PowerPoint. This is the key step for publication-grade control (alignment, typography, consistent sizing).
9) Export final submission formats: Download the final figure in the format you need (commonly SVG/PPTX/PNG; the platform also supports publication-oriented exports depending on the tool). Use vector formats when possible for crisp scaling in peer review and print.
10) Create a data chart in SciDraw Visualization: Go to https://sci-draw.com/sci-vis and upload your CSV/Excel file. SciDraw AI will suggest chart types (e.g., box, violin, scatter, heatmap, regression) based on the data.
11) Choose a journal preset and palette: Apply one-click journal styles (e.g., Nature/Science/Cell/PLOS/ACS) and use colorblind-safe palettes (e.g., Okabe-Ito) to match common publication standards.
12) Export chart + reproducible code: Export the chart in publication formats (e.g., PNG/PDF/EPS/TIFF as available) and download the auto-generated matplotlib/seaborn code so the figure can be reproduced and version-controlled.
13) Combine schematic + data plots into a multi-panel figure (optional): If your paper needs a multi-panel layout, generate the schematic/diagram in AI Drawing and the plots in Visualization, then assemble them into a single multi-panel figure using SVG/PPTX editing (or your preferred layout tool) for consistent fonts, spacing, and panel labels.
14) Keep a clean, review-ready design checklist: Before submission, verify: terminology accuracy, arrow directions, consistent symbols, minimal text, readable labels, and vector output. If using AI-generated content, manually confirm scientific relationships to avoid errors.
SciDraw AI FAQs
SciDraw AI is an AI-powered platform for creating publication-ready scientific figures, diagrams, graphical abstracts, posters, and data visualizations for papers, theses, posters, slides, and teaching.
Popular Articles

Atoms: A Multi-Agent AI Platform That Transforms Ideas into Launch-Ready Products
May 22, 2026

Nano Banana SBTI: What It Is, How It Works, and How to Use It in 2026
Apr 15, 2026

Atoms Review — The AI Product Builder Redefining Digital Creation in 2026
Apr 10, 2026

Kilo Claw: How to Deploy and Use a True "Do‑It‑For‑You" AI Agent(2026 Update)
Apr 3, 2026