
TraceLLM
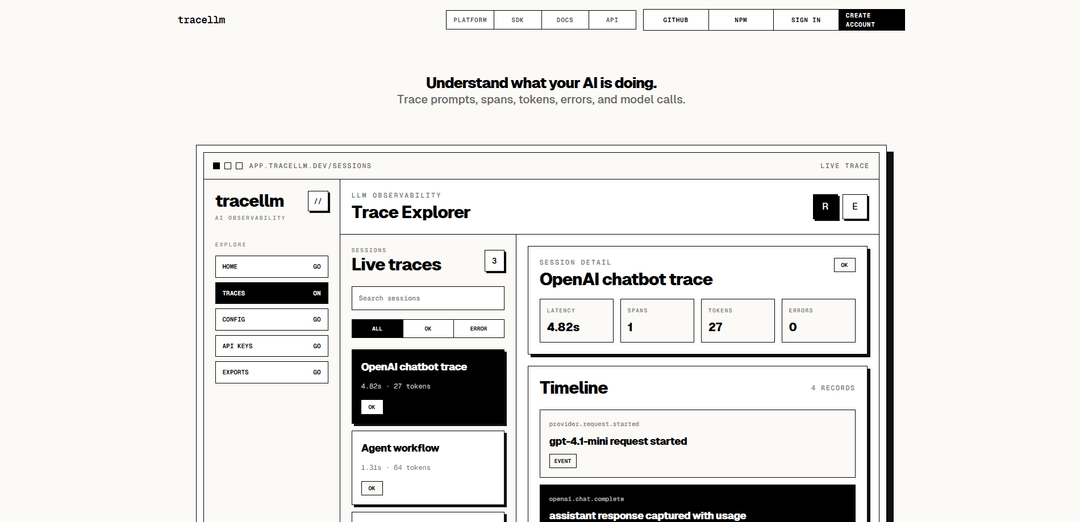
TraceLLM is a local-first LLM observability platform that traces sessions, spans, prompts/outputs (optionally), tokens, latency, and errors across AI workflows, with policy controls and OpenTelemetry (OTLP) export support.
https://tracellm.in/?ref=producthunt
Product Information
Updated:Aug 8, 2026
What is TraceLLM
TraceLLM is an observability and debugging product for production LLM applications that consolidates model calls and surrounding app activity into a single, queryable trace. It is designed for modern AI systems—chatbots, agent workflows, and RAG services—where a single user request can trigger multiple model invocations, tool calls, and intermediate steps that are otherwise hard to inspect after the fact. TraceLLM provides a “one timeline per AI workflow” experience, capturing key operational signals (latency, token usage, errors, metadata) and, when enabled, the prompt and model output, so teams can understand exactly what happened during a problematic run.
Key Features of TraceLLM
TraceLLM is an LLM observability and tracing product that captures end-to-end AI workflow execution as a single, queryable timeline—covering sessions, spans, lifecycle events, token usage, latency, provider/model calls, and errors—with configurable capture/redaction policies and optional OpenTelemetry (OTLP) export to existing monitoring stacks (e.g., SigNoz). It’s designed to make multi-step LLM apps (chatbots, agents, RAG, tool-using workflows, routers/gateways) debuggable by preserving the context needed to investigate wrong answers, performance regressions, token spikes, and failures across providers and frameworks.
Session + span timeline (“one trace, one story”): Records each AI workflow as a unified trace with sessions, spans, and events so you can see exactly what happened—from request start to model completion—without stitching together vendor dashboards and scattered logs.
Usage, latency, and error observability: Captures token counts, timing/latency, request status, and exceptions attached to the same trace to quickly diagnose bottlenecks, cost spikes, and failure modes in production.
Prompt/output capture with policy controls: Supports optional prompt and model-output capture, governed by project-level controls (capture on/off, metadata-only modes, redaction, sampling) to balance debugging value with privacy/compliance needs.
Drop-in SDK instrumentation (Node): Provides a lightweight SDK that wraps real model calls without changing where requests run, supporting common LLM app patterns such as agents, RAG, tools, and gateways.
Provider- and framework-agnostic workflow tracing: Designed to trace across heterogeneous stacks and model providers (e.g., OpenAI/Claude/Gemini patterns mentioned), enabling a unified operational view even when teams use multiple models and runtimes.
OpenTelemetry (OTLP) export pipeline: Exports the same product-level traces to external observability systems via OTLP (e.g., SigNoz), letting teams integrate LLM workflow telemetry into existing monitoring and alerting pipelines.
Use Cases of TraceLLM
Customer support chatbot debugging: When users report a wrong or unsafe answer, engineers can open the exact session, inspect the model span (provider/model/tokens/latency), and review surrounding events to pinpoint grounding/retrieval/tooling issues.
Agentic workflow reliability (tools + multi-step planning): Tracks chains of model calls and tool invocations so teams can identify where an agent looped, chose the wrong tool, failed silently, or produced a confidently wrong response despite “healthy” latency/tokens.
RAG quality and grounding investigations: Helps diagnose retrieval-answer failures by correlating retrieval/tool events with the final response, making it easier to see whether the right context was fetched and how it influenced the output.
Cost and performance optimization for production AI: Uses token usage and latency per span to find expensive prompts, regressions, and hotspots, enabling targeted prompt/route/model changes before costs or tail latency impact users.
Multi-provider model routing and A/B operations: In environments using multiple providers/models, TraceLLM provides a single view of behavior across routes, making it easier to compare reliability, cost, and latency across deployments.
Pros
Unified trace timeline across model calls, app events, usage, and errors—reduces time spent correlating disparate logs and vendor dashboards.
Policy-driven capture (sampling/redaction/metadata-only) plus OTLP export supports both privacy needs and integration with existing observability stacks.
Designed for real-world LLM app patterns (agents, RAG, tools, gateways) and multi-provider setups.
Cons
Capturing prompts/outputs can introduce privacy/compliance risk if policies are misconfigured; careful redaction and sampling are required.
SDK coverage shown is primarily Node in the provided sources; teams on other runtimes may need additional support or custom instrumentation.
Observability adds operational overhead (instrumentation, storage, and review workflows), especially at high trace volumes.
How to Use TraceLLM
1) Choose which “TraceLLM” you mean (observability vs. research frameworks): The name “TraceLLM” is used by multiple projects in the sources: (A) TraceLLM observability product (tracellm.in) for tracing prompts/spans/tokens/errors and exporting via OTLP; (B) an MCP-server-based logger exposing tools like log_action/get_logs/get_summary; (C) research codebases named TraceLLM (e.g., microservice trace generation; requirements traceability). The steps below focus on the TraceLLM observability product because it provides end-user “how to use” docs and SDK snippets in the sources.
2) Create a TraceLLM project and get an API key: In the TraceLLM web app (linked from tracellm.in/app), create a project. Copy the project API key (shown like trllm_live_••••••••••••••). The key controls ownership plus SDK behavior such as capture policy, redaction, and sampling.
3) Install the Node SDK: Add the SDK to your Node project as shown on the site: `pnpm add @use-tracellm/sdk-node`.
4) Wrap real model calls with TraceLLM spans (drop-in tracing): Use the SDK to create a span around your actual provider call without changing where requests run. Example pattern from the site: `trace.span({ provider: "openai", model: "gpt-4.1-mini" })` around the code that performs the LLM request. This captures a single workflow record with spans, lifecycle events, latency, and token usage (when available from OpenAI-compatible responses).
5) Capture full workflow context (sessions, spans, events, errors, tokens, metadata): Organize traces so one user workflow becomes one debugging record: use a session name (e.g., chatbot.request), then record model spans (e.g., openai.chat.complete), and add lifecycle events (provider.request.started, provider.response, tool/retrieval events). Ensure errors are recorded on the same trace so failures remain attached to the session timeline.
6) Add custom attributes and events during execution (optional): If your SDK supports active-span access (as shown in the sources), add runtime attributes and events: get the active span, set attributes like `custom.metric`, and add events like `cache_hit` with structured fields (e.g., `{ key: "user_context" }`). This helps correlate app-level signals with model behavior.
7) Trace multi-step workflows (chains) with nested spans: For agent/RAG/tool pipelines, create a parent workflow span (a “chain”) and nest child spans for LLM calls, retrieval, and tools. The sources show a pattern where nested spans automatically become children of the parent, producing a single coherent timeline for the whole workflow.
8) Configure capture policy, redaction, and sampling: In the TraceLLM UI (or via project settings tied to the API key), configure what gets captured: content capture on/off, metadata on/off, redaction on, and sampling (example shown: 70%). This controls whether prompts/outputs are stored and how sensitive data is handled.
9) View traces in the Trace Explorer (sessions and live traces): Open the TraceLLM app and use Sessions/Live traces to find a workflow by session name, status (ok/error), or timestamp. Inspect the model span to see provider/model, latency, token usage, and request status. Review the timeline of events and any attached errors.
10) Use TraceLLM to debug a reported bad answer (recommended workflow): Follow the investigation path described on the site: (1) open the user session; (2) inspect the model span for latency/tokens/status; (3) read captured events around tools/retrieval/provider calls; (4) follow the failure—errors remain attached with message/type/stack/metadata.
11) Export traces via OpenTelemetry (OTLP) to SigNoz (optional): Enable OTLP export so the same workflow traces can be forwarded to an OTLP destination like SigNoz. The site describes an export pipeline: TraceLLM API → OTLP Collector → SigNoz, allowing you to keep product-level traces in TraceLLM while also sending them to your observability stack.
12) (Alternative) If you meant the MCP-server “Tracellm” logger, run it and call its tools: Some sources describe a pure MCP server exposing three tools: `log_action`, `get_logs`, and `get_summary`, with SSE-over-HTTP transport (port 8001). In that setup, your app/agent calls `log_action` after meaningful interactions (user message, LLM response, tool call, error). Logging is designed to be non-blocking: if the server is unavailable, the primary LLM flow continues without interruption.
13) (Alternative) If you meant the research TraceLLM repos, set up the environment and run preprocessing: Other sources describe research codebases (e.g., microservice call-graph trace generation) with setup like: create a conda env (python=3.8), install poetry, run `poetry install`, then install additional requirements under `trace_gen`. They also describe preprocessing scripts to convert traces to call graphs and compute stats (e.g., `trace_to_cg_stats.py`, `merge_cg_stats.py`) and converting call graphs to text representations with task_type set appropriately.
TraceLLM FAQs
TraceLLM is an LLM observability and tracing product that records AI workflow activity—prompts, spans, tokens, errors, and model calls—so you can debug and understand what happened in a single end-to-end trace.
Popular Articles
Atoms: A Multi-Agent AI Platform That Transforms Ideas into Launch-Ready Products
May 22, 2026

Nano Banana SBTI: What It Is, How It Works, and How to Use It in 2026
Apr 15, 2026

Atoms Review — The AI Product Builder Redefining Digital Creation in 2026
Apr 10, 2026
Kilo Claw: How to Deploy and Use a True "Do‑It‑For‑You" AI Agent(2026 Update)
Apr 3, 2026
Latest AI Tools Similar to TraceLLM

Hapticlabs
Hapticlabs is a no-code toolkit that enables designers, developers and researchers to easily design, prototype and deploy immersive haptic interactions across devices without coding.
Deployo.ai
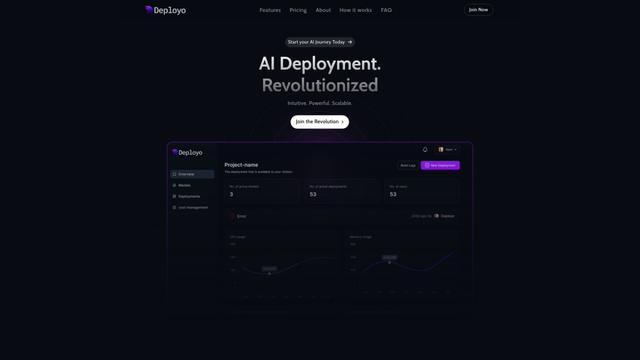
Deployo.ai is a comprehensive AI deployment platform that enables seamless model deployment, monitoring, and scaling with built-in ethical AI frameworks and cross-cloud compatibility.
CloudSoul
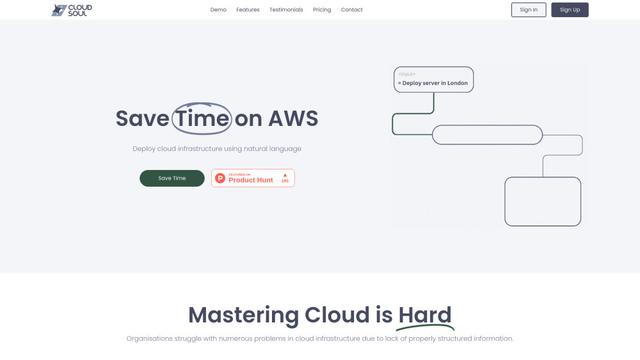
CloudSoul is an AI-powered SaaS platform that enables users to instantly deploy and manage cloud infrastructure through natural language conversations, making AWS resource management more accessible and efficient.
Devozy.ai
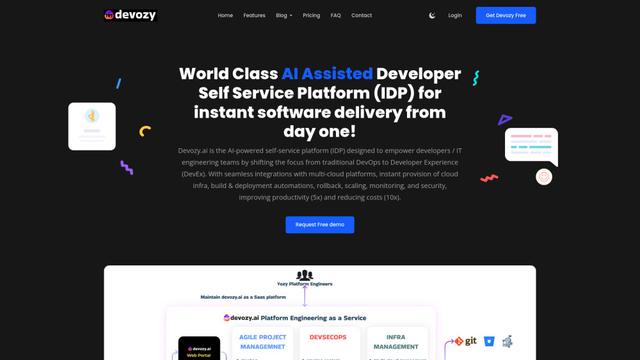
Devozy.ai is an AI-powered developer self-service platform that combines Agile project management, DevSecOps, multi-cloud infrastructure management, and IT service management into a unified solution for accelerating software delivery.
Popular AI Tools Like TraceLLM

A2A Protocol
A2A (Agent2Agent) Protocol is an open interoperability protocol developed by Google that enables seamless communication and collaboration between AI agents across different frameworks and vendors, regardless of their underlying architecture.
VoltOps
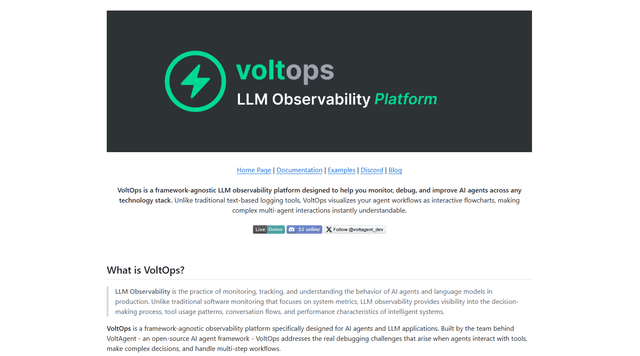
VoltOps is a framework-agnostic LLM observability platform that provides real-time visual monitoring, debugging, and optimization tools for AI agents across any technology stack.
Chaterm
Chaterm is an open-source AI-native terminal and SRE copilot that enables engineers to manage complex infrastructure through natural language, automating deployment, troubleshooting, and operations without memorizing commands.
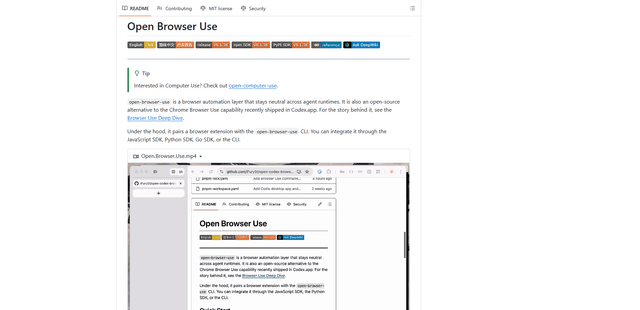
Open Browser Use
Open Browser Use is an open-source, agent-runtime-neutral browser automation layer that pairs a Chrome extension with a CLI/SDK/MCP to enable DOM-aware, CDP-powered tab control, navigation, and actions across different AI agent tools.