Progress AI Observability
WebsiteFree
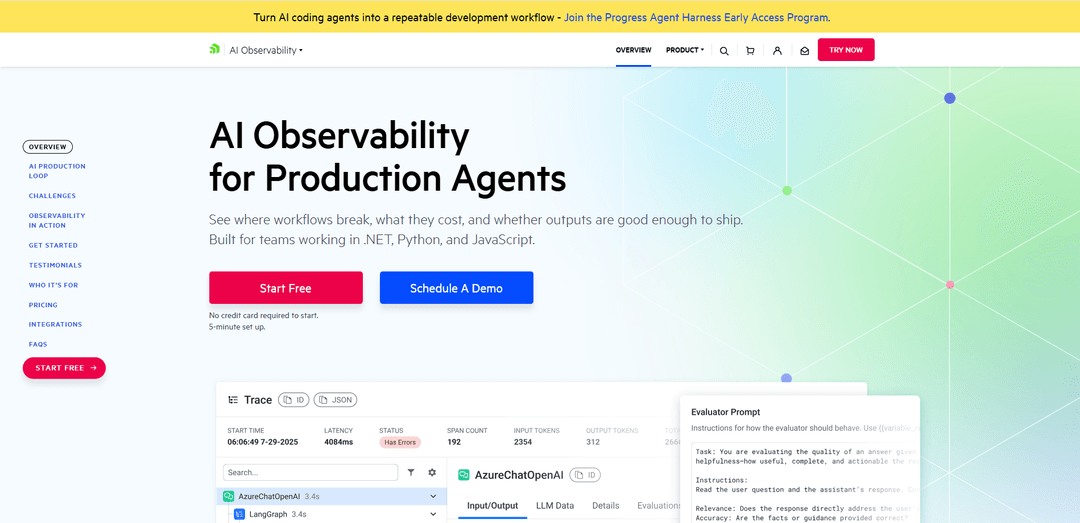
Progress AI Observability is a cloud-based observability platform for production AI agents that provides end-to-end tracing, fast debugging, cost/token analytics, and quality evaluations across multi-step workflows in .NET, Python, and JavaScript.
https://www.telerik.com/ai-observability-platform?ref=producthunt
Product Information
Updated:Aug 14, 2026
What is Progress AI Observability
Progress AI Observability (Progress AI Observability Platform) is an AI-specific observability platform built to give teams deep visibility into how AI agents and LLM applications behave in real environments—so they can debug faster, optimize reliability, control spend, and trust outputs in production. Unlike traditional monitoring that focuses on infrastructure metrics and logs, it captures agent execution paths across prompts, model calls, retrieval steps (RAG), and tool usage, then connects that trace data to performance (latency), usage (tokens), estimated cost, and quality signals (evaluations). It is designed to complement existing monitoring/logging stacks, integrate with common agent frameworks and LLM providers, and support enterprise needs such as audit trails, PII redaction, SSO, and data residency options.
Key Features of Progress AI Observability
Progress AI Observability is an observability platform purpose-built for LLM applications and AI agent workflows, providing end-to-end tracing across prompts, model calls, retrieval, and tool usage so teams can debug failures, control latency and token-driven costs, and evaluate output quality over time. It offers native .NET support with first-class Semantic Kernel integration, works across .NET/Python/JavaScript and major model providers (e.g., Azure OpenAI, OpenAI, Anthropic), and includes enterprise-grade governance capabilities such as audit trails, PII redaction, and data residency options. The platform is designed to be lightweight and asynchronous, complementing existing monitoring/logging stacks by adding AI-specific visibility rather than replacing them.
End-to-end agent tracing: Captures full execution paths across prompts, model calls, retrieval steps, tool calls, retries, sessions, latency, token usage, and outputs—making multi-step and multi-agent workflows understandable in production.
AI-specific debugging workflows: Helps pinpoint non-obvious failures (e.g., skipped tools, bad retrieval context, loops/retries, cascading tool errors) using trace-level context rather than relying on generic application logs.
Cost and token analytics with attribution: Tracks input/output tokens and estimated LLM cost, attributing spend by model, provider, agent, app/team, and workflow patterns so teams can identify and reduce token waste before costs scale.
Quality evaluation loop (LLM-as-a-judge): Runs evaluations on captured production traces to score response quality, usefulness, and policy alignment; supports comparing prompt/model/workflow changes and building evaluation coverage over time.
Microsoft-ecosystem friendly integrations: Provides native .NET support and instrumentation, first-class Semantic Kernel integration, and supports Microsoft.Extensions.AI and Microsoft AI Foundry—fitting naturally into Microsoft-centric teams.
Enterprise governance and compliance controls: Includes features such as audit trails, PII redaction, SSO support (Okta, Azure AD, SAML), and data residency/retention options to help governed teams operate production AI safely.
Use Cases of Progress AI Observability
Customer support agent reliability (SaaS/tech): Trace why a support copilot produced an unhelpful or incorrect answer by inspecting retrieval context, tool calls (CRM/ticketing), and prompt/model changes; reduce escalations and improve resolution quality.
Regulated enterprise copilots (finance/healthcare): Use audit trails, retention controls, and PII redaction to support compliance requirements while monitoring agent behavior for unsafe or policy-violating outputs and investigating incidents quickly.
RAG knowledge assistants (internal enablement): Diagnose retrieval issues (wrong sources, stale context, missing citations) and measure quality with evaluations tied to production traces to improve grounding and reduce hallucinations.
Cost governance for high-volume LLM features (consumer apps): Attribute spend and token usage by feature/workflow and identify expensive patterns like long prompts, repeated calls, retries, or agent loops; optimize model choice and workflow design to control bills.
Production incident investigation for agent workflows (platform teams): Correlate latency spikes and failures to specific spans (e.g., slow retrieval, failing tool calls, overloaded model endpoints) and use trace evidence to speed root cause analysis and remediation.
.NET + Semantic Kernel agent development (Microsoft teams): Instrument agents quickly with the .NET SDK to capture traces locally and in production, compare prompt/model iterations, and create a repeatable release loop from evidence-driven debugging and evaluation.
Pros
Purpose-built for LLM/agent workflows (prompts, retrieval, tools, sessions), not just traditional app monitoring or classic ML observability.
Strong fit for Microsoft/.NET teams with native .NET support and Semantic Kernel integration plus broad provider/framework compatibility.
Connects trace evidence to both cost (token usage) and quality (evaluations), enabling continuous improvement rather than one-off debugging.
Enterprise-ready controls (SSO, audit trails, PII redaction, data residency/retention) for governed deployments.
Cons
Focused on LLM apps and agent workflows rather than traditional ML observability needs like feature drift and prediction quality for trained ML models.
Value depends on instrumentation and trace capture; teams must integrate SDKs and manage what data is collected (especially for sensitive prompts/outputs).
Retention and volume-based pricing/units may require planning for high-traffic agents to avoid unexpected usage growth.
As a specialized layer, it complements rather than replaces existing observability stacks, which can add another tool to operate.
How to Use Progress AI Observability
1) Create an account and get access: Go to the Progress AI Observability Platform page and click “Start Free” (no credit card required). In the Observability web app, create/sign in to your workspace and obtain the values you’ll need for instrumentation: an API key and an App Name.
2) Add the .NET SDK to your application: In your .NET project, install the Progress AI Observability instrumentation package:
dotnet add package Progress.Observability.Instrumentation
3) Configure credentials via environment variables: Set the environment variables used by the SDK:
- OBSERVABILITY_APP_NAME: your application name in Progress AI Observability
- OBSERVABILITY_API_KEY: your API key
This keeps secrets out of source code and makes it easy to switch between local/dev/prod environments.
4) Instrument your LLM/agent client (minimal code change): Wrap or extend your chat/LLM client with observability so traces are captured automatically. Example from the official page:
chatClient = chatClient.AddObservability(options =>
{
options.AppName = Environment.GetEnvironmentVariable("OBSERVABILITY_APP_NAME")!;
options.ApiKey = Environment.GetEnvironmentVariable("OBSERVABILITY_API_KEY")!;
});
5) Run your agent locally and generate a trace: Execute a normal agent run (prompt → retrieval/tool calls → model response). The platform is designed to be lightweight and asynchronous, so instrumentation should not meaningfully impact user-facing latency. After a run completes, a trace should be available in the dashboard.
6) Open Trace Explorer to see the full execution path: In the Progress AI Observability UI, open the trace view (Trace Explorer). Inspect the end-to-end workflow across prompts, model calls, retrieval steps, tool calls, outputs, latency, and token usage. Use this to understand what your agent actually did across multi-step or multi-agent flows.
7) Debug failures using trace-level context: Use the debugging views to pinpoint where behavior broke down. Look for patterns such as skipped tools, retrieval issues/bad context, loops, retries, errors, tool failures, and latency spikes. This is especially useful when the agent returns a “successful” response that is still wrong or ungrounded.
8) Analyze token usage and estimated cost tied to traces: Open cost analytics/cost attribution views to see estimated cost, input/output tokens, and cost by model/provider/agent/workflow. Use trace context to identify what runtime behaviors are driving spend (e.g., long prompts, repeated calls, retries, inefficient retrieval, agent loops).
9) Evaluate output quality with LLM-as-a-Judge evaluations: Run evaluations on captured traces to score quality, usefulness, groundedness, safety/policy alignment, etc. Use built-in evaluator templates (or customize your own) to define judge instructions and scoring criteria. Review evaluation scores, judge verdicts, and quality trends in scorecards.
10) Compare changes (prompt/model/workflow) using real execution data: Use the platform’s before/after comparisons to validate changes prior to release. Compare traces and evaluation results side-by-side when you change prompts, models, retrieval settings, or tool/workflow logic to confirm improvements in quality, latency, and cost.
11) Build regression checks and datasets from production evidence: Use observed traces and low evaluation scores to curate evaluation datasets and create repeatable regression checks. This turns production failures into test cases so you can prevent repeat incidents and continuously improve prompts, models, retrieval, tools, and workflows.
12) Deploy to production with the same workflow: Keep the same instrumentation in production to investigate incidents and monitor real agent behavior. The platform is intended to complement (not replace) your existing monitoring/logging stack by adding AI-specific visibility into prompts, tool use, retrieval, outputs, latency, and token usage.
13) (Optional) Integrate with your existing stack and enterprise controls: If needed, align with enterprise requirements such as audit trails, PII redaction, data residency, retention, and SSO (e.g., Azure AD/Okta/SAML). Use these controls to scale governed AI applications while maintaining trace history and operational oversight.
Progress AI Observability FAQs
Progress AI Observability Platform is an observability product for production AI agents, LLM apps, RAG systems, and copilots that helps teams trace workflows end-to-end, debug failures, control token/cost spend, and evaluate output quality using real execution data.
Popular Articles
Atoms: A Multi-Agent AI Platform That Transforms Ideas into Launch-Ready Products
Oct 13, 2026

Nano Banana SBTI: What It Is, How It Works, and How to Use It in 2026
Apr 15, 2026

Atoms Review — The AI Product Builder Redefining Digital Creation in 2026
Apr 10, 2026
Kilo Claw: How to Deploy and Use a True "Do‑It‑For‑You" AI Agent(2026 Update)
Apr 3, 2026