
Autoplot
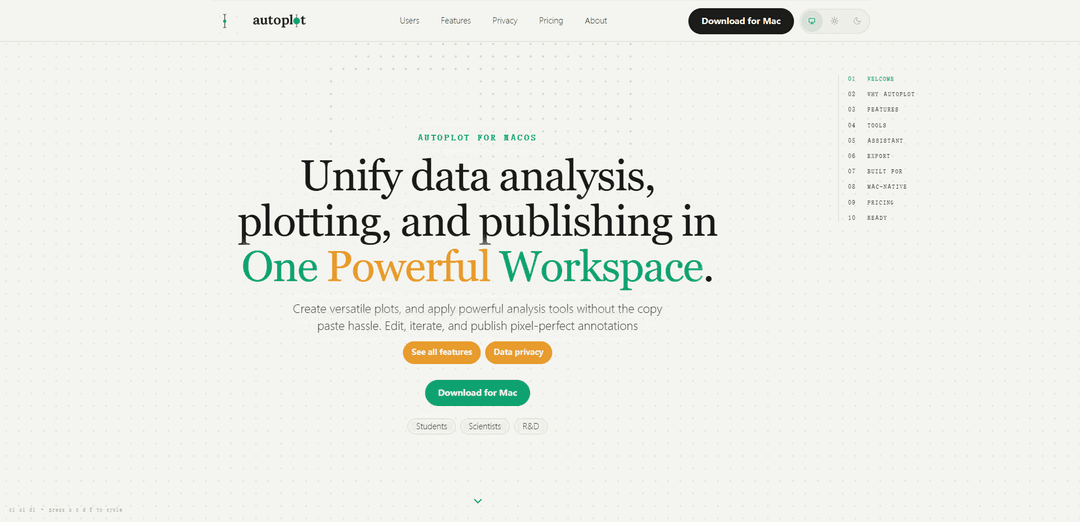
Autoplot is a native, local-first macOS workspace that turns tabular scientific data into publication-ready plots, fits, heat maps, and reusable analysis outputs, with offline Python tooling and an optional privacy-respecting AI assistant.
https://autoplot.ai/?ref=producthunt
Product Information
Updated:Aug 8, 2026
What is Autoplot
Autoplot is a Mac-native application designed to unify the everyday workflow of scientific data work—importing data, cleaning and transforming it, running analyses, creating high-quality visualizations, and exporting figures for papers or presentations—inside a single workspace. Built for Apple Silicon and optimized for working directly with files on disk, it aims to replace the common “multi-tool” loop of bouncing between scripts, terminals, and image editors. It supports common scientific plotting and analysis needs (e.g., X–Y plots, histograms with fits, log-binned and power-law analysis, heat maps, correlations, and more depending on plan) and provides vector PDF export with embedded fonts for print-ready results.
Key Features of Autoplot
Autoplot is a native macOS workspace for scientific plotting and analysis that unifies importing, cleaning/treating, analyzing, visualizing, and publishing figures in one place. It is local-first by default (raw data stays on disk), works offline with a self-contained scientific Python stack (e.g., NumPy/SciPy/Matplotlib), and supports producing publication-ready exports like vector PDFs. An optional AI assistant can help generate and run local Python-based transformations and drive the app’s tools via natural language while emphasizing privacy (intent/schema-first, confirmation before execution).
All-in-one scientific workspace: Import, treat, analyze, plot, annotate, and compose publishable figures without bouncing between terminals, LLMs, and separate image/text editors.
Mac-native, Apple Silicon–tuned performance: A real SwiftUI macOS app designed for fast launch, native scrolling, and handling large arrays more smoothly than browser-based tools.
Local-first & offline operation: Opens large local files directly from disk with no upload step; includes an embedded scientific Python environment so core workflows run without network access.
Flexible data import and preparation: One-click imports from local files or SFTP, delimiter/header/encoding control, and native merge/header treatment to consolidate multiple files into a project.
Built-in analysis and plotting surfaces: Supports common scientific outputs such as X–Y plots, histograms with fits, heat maps with 2D fits, correlations, categorical charts, and 3D (advanced features vary by plan).
Optional AI assistant for local Python and app automation: Can draft Python to splice/filter/derive variables and help drive end-to-end actions (import → derive → plot → annotate → export), with user confirmation and privacy-oriented boundaries.
Use Cases of Autoplot
Academic lab figure production: Students and researchers can iterate on plots, fits, and annotations quickly and export journal-ready vector PDFs with embedded fonts.
R&D and industrial analysis under NDAs: Teams analyzing proprietary experimental data can keep raw datasets local/offline while still using a modern plotting and analysis workflow.
High-volume CSV exploration: Engineers and analysts can open and visualize large tabular datasets directly from disk (avoiding browser upload limits) and generate diagnostics like correlations or heat maps.
Multi-file instrument/log consolidation: Merge and normalize multiple measurement files (headers/encodings/delimiters) into a single project for consistent analysis and plotting.
Assisted data transformation without heavy scripting: Users who prefer minimal code can rely on the assistant to draft local Python transformations for filtering, deriving variables, or reshaping data before plotting.
Pros
Local-first privacy: raw data stays on the Mac by default; offline workflows supported.
Native macOS experience: optimized for Apple Silicon with a unified, document-based workspace.
Publish-ready exports: vector PDF (plus PNG/JPG) reduces rework when iterating figures.
Cons
macOS-only: not suitable for Windows/Linux-only teams or standardized cross-platform deployments.
Some advanced capabilities are paywalled by tier (e.g., certain advanced analysis/plot surfaces and higher hosted-AI credit limits).
AI features depend on credits/plan for heavier usage, and fully offline assistance may be more limited than hosted options.
How to Use Autoplot
1) Download and install Autoplot for macOS: Go to https://autoplot.ai/ and download the Mac app (v1 build). Install it like a standard macOS application, then launch it.
2) Create or open a project (document-based workflow): Start a new Autoplot project (or open an existing one). Autoplot projects are designed so your imported data, plots, and publishing layout stay linked—when you change a card, the figure updates without re-running scripts.
3) Import data from local disk (local-first) or SFTP: Use the import flow to bring in data from local files (e.g., large CSVs) or SFTP. Autoplot is designed to open large arrays directly from disk—no upload step and no browser limits.
4) Configure parsing: delimiter, header, encoding: When importing tabular data, set the delimiter (comma/tab/etc.), whether the file has a header row, and the text encoding. This is the built-in 'header treatment' and parsing setup.
5) Merge multiple files into one project (optional): If your dataset is split across files, use Autoplot’s native merge tools during import to combine them into a single project dataset—no external scripts required.
6) (Optional) Use Python on import to splice/filter/derive variables: If you need transformations (filter rows, compute a derived column, splice segments), use the assistant to draft Python that runs locally inside Autoplot’s bundled scientific Python stack (NumPy/SciPy/Matplotlib). You review and confirm before it runs.
7) Create a first plot quickly (X–Y, histogram, etc.): Add a plotting card/surface and choose a plot type appropriate to your data (e.g., X–Y plot for paired columns, histogram for distributions). Autoplot aims to give reasonable defaults so you can iterate from a working baseline.
8) Apply analysis tools directly in the workspace: Use the built-in analysis surfaces/tools as needed. The site highlights distribution-focused tools such as PDF/log-binned/power-law analysis and histogram fits, plus additional advanced surfaces depending on your plan (e.g., CDF/CCDF, correlations, heat maps with 2D fits, 3D).
9) Refine styling and add pixel-perfect annotations: Adjust axis labels/ranges and add annotations within Autoplot so the figure is publication-ready. The goal is to avoid copy-paste cycles between analysis, plotting, and external image editors.
10) Compose a multi-figure board/layout (Compose surface): If you need a figure panel (multiple plots, captions, callouts), use the Compose feature (available in higher tiers). Arrange plots and annotations into a single publishable layout.
11) Use the Assistant to drive the app end-to-end (optional): In plain language, ask the assistant to perform chained actions (import a file → derive a variable → build a plot → annotate → compose → export). Autoplot’s assistant is designed to respect the data boundary: it reads your intent and schema, and you confirm before anything runs locally.
12) Export publication-ready outputs (vector + raster): Export your final figure as vector PDF (print-ready, embedded fonts) and/or PNG/JPG. Because plots are linked to the project, you can revise a card and re-export without rebuilding everything.
13) Work offline when needed: Use Autoplot without network access for core analysis/plotting because the scientific Python stack runs inside the app. Hosted assistant usage depends on your plan’s monthly credits, but the local workflow remains available offline.
Autoplot FAQs
Autoplot is an interactive tool for browsing, plotting, and analyzing scientific data. It aims to take a data file (or URL) and quickly produce a sensible plot, supporting formats such as CDF, netCDF, ASCII, and more.
Popular Articles

Atoms: A Multi-Agent AI Platform That Transforms Ideas into Launch-Ready Products
May 22, 2026

Nano Banana SBTI: What It Is, How It Works, and How to Use It in 2026
Apr 15, 2026

Atoms Review — The AI Product Builder Redefining Digital Creation in 2026
Apr 10, 2026

Kilo Claw: How to Deploy and Use a True "Do‑It‑For‑You" AI Agent(2026 Update)
Apr 3, 2026
Latest AI Tools Similar to Autoplot

CalcGen AI
CalcGen AI is an AI-powered platform that enables users to effortlessly create and embed interactive data visualizations, charts, graphs, and calculators through simple prompts.

Capital Companion
Capital Companion is an AI-powered trading assistant that provides 24/7 market insights, personalized recommendations, and advanced analytics to give traders a competitive edge.

MarketAlerts.ai
MarketAlerts.ai is an AI-powered stock analysis platform that provides personalized watchlists, smart screening, technical pattern recognition, and custom alerts to help investors make informed trading decisions.
FxChartAI
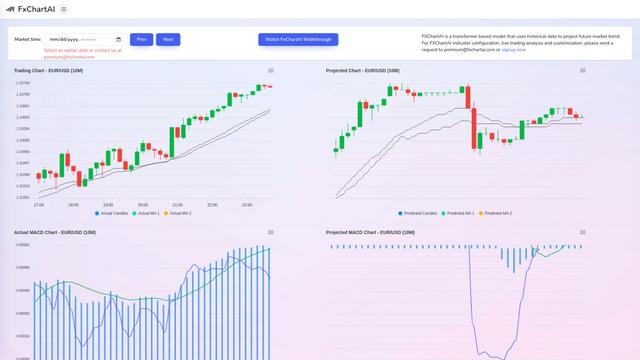
FxChartAI is an advanced AI-powered Forex prediction and analysis tool that uses transformer models to project future market trends.
Popular AI Tools Like Autoplot
Microsoft Excel: Spreadsheets
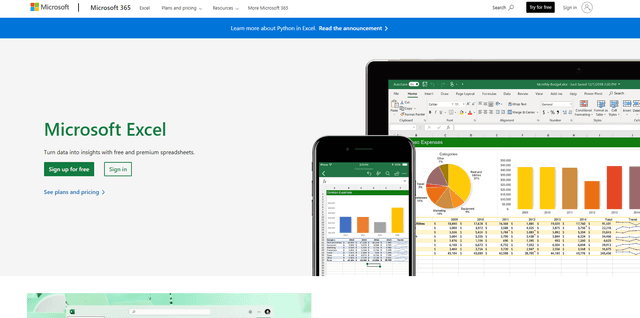
Microsoft Excel is the industry-leading spreadsheet software that allows users to organize, analyze, and visualize data through powerful features like formulas, charts, and AI-powered insights.
Metabase
Metabase is an open-source business intelligence and data visualization platform that enables users to query, analyze and share data insights through an intuitive interface without requiring SQL knowledge.
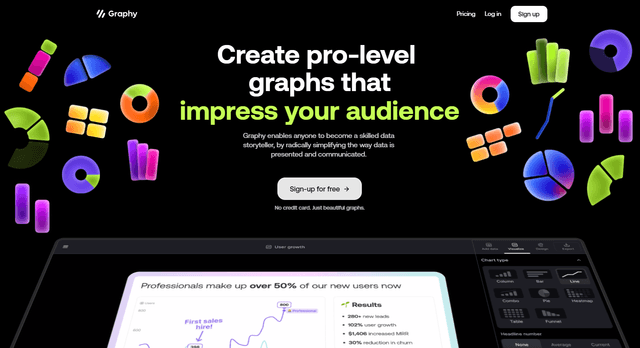
Graphy AI
Graphy AI is an AI-powered data visualization tool that creates charts, generates insights, and simplifies data storytelling.

AIFlowChart.io
AIFlowChart.io is an AI-powered online tool that generates flowcharts, diagrams, and visual representations from text, PDFs, or images using ChatGPT technology.