EOS Data Analytics Come Usare
EOS Data Analytics è un fornitore globale di analisi delle immagini satellitari potenziate dall'AI per l'agricoltura, la silvicoltura e la sostenibilità.
Visualizza AltroCome usare EOS Data Analytics
Registrati per un account: Visita il sito web di EOS Data Analytics e crea un account gratuito per accedere alle loro immagini satellitari e strumenti di analisi.
Scegli un prodotto: Seleziona il prodotto appropriato per le tue esigenze - EOSDA Crop Monitoring per l'agricoltura, EOSDA Forest Monitoring per la silvicoltura, o EOSDA LandViewer per l'analisi generale delle immagini satellitari.
Definisci la tua area di interesse: Utilizza l'interfaccia della mappa per disegnare o caricare i confini dell'area che desideri analizzare.
Seleziona i dati satellitari: Scegli tra le fonti di immagini satellitari disponibili e le fasce di date per la tua area di interesse.
Applica analisi: Utilizza gli strumenti integrati per analizzare gli indici di vegetazione, rilevare cambiamenti, classificare l'uso del suolo, prevedere i raccolti o eseguire altre analisi pertinenti al tuo caso d'uso.
Visualizza i risultati: Visualizza i dati analizzati come mappe, grafici e diagrammi codificati a colori nell'interfaccia web.
Genera report: Crea report in PDF o CSV che riassumono i risultati delle analisi per la tua area di interesse.
Imposta il monitoraggio: Configura avvisi per essere notificato di cambiamenti o condizioni specifiche nella tua area di interesse nel tempo.
Integra tramite API: Per utenti avanzati, accedi alle capacità di EOS Data Analytics programmaticamente utilizzando la loro API.
FAQ di EOS Data Analytics
EOS Data Analytics ha sede a Menlo Park, California, Stati Uniti.
Tendenze del traffico mensile di EOS Data Analytics
EOS Data Analytics ha registrato un aumento del 6,5% arrivando a 815K visite a luglio. Questa crescita è probabilmente dovuta ai continui miglioramenti nella tecnologia blockchain e nelle innovazioni delle fotocamere, oltre all'attenzione dell'azienda verso scalabilità, interoperabilità e risorse per gli sviluppatori.
Visualizza storico del traffico
Articoli Popolari

Recensione di FLUX.1 Kontext 2025: Lo strumento definitivo di editing immagini AI che rivaleggia con Photoshop
Jun 5, 2025
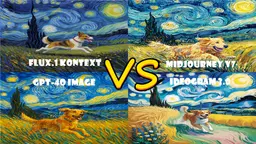
FLUX.1 Kontext contro Midjourney V7 contro GPT-4o Image contro Ideogram 3.0 nel 2025: FLUX.1 Kontext è davvero la migliore IA per la generazione di immagini?
Jun 5, 2025

Come Creare Video Podcast Virali di Bambini Parlanti con l'AI: Guida Passo-Passo (2025)
Jun 3, 2025

I 5 migliori generatori di personaggi NSFW nel 2025
May 29, 2025
Ultimi Strumenti AI Simili a EOS Data Analytics

Personalized License Plate Generator
Uno strumento alimentato da AI che genera design di targhe uniche e personalizzate basate sull'input dell'utente.

Keak
Keak è uno strumento di test A/B alimentato dall'IA che genera automaticamente variazioni del sito web, avvia test e ottimizza le conversioni.

Makeasite
Makeasite è un innovativo costruttore di siti web che consente agli utenti di creare e condividere siti web rapidamente utilizzando solo prompt.

Adviseful
Adviseful è uno strumento alimentato dall'IA che accelera la pianificazione di app web e mobili per consulenze IT e agenzie digitali, trasformando idee in contatti qualificati in pochi minuti.
Strumenti AI Popolari Come EOS Data Analytics
GPT Engineer
GPT Engineer è uno strumento di sviluppo software alimentato dall'IA che consente a chiunque di costruire applicazioni web chiacchierando con un ingegnere IA.

Framer
Framer è un potente costruttore web che consente ai designer di creare siti web straordinari e reattivi con un'interfaccia intuitiva e pubblicarli istantaneamente senza codifica.

GPT Engineer
GPT Engineer è un costruttore di app web alimentato dall'IA che consente agli utenti di creare applicazioni full-stack attraverso suggerimenti in linguaggio naturale e interazioni in chat.

10Web
10Web è una piattaforma di creazione e hosting di siti web alimentata da IA che offre creazione di siti web IA, hosting WordPress gestito e strumenti di ottimizzazione automatizzati.
Visualizza altro